14. Listopad 2019 | November 2019 Rejestr Gwarancji Pochodzenia | Guarantee of Origin Register Dane o obrocie i transferze w Rejestrze | Register Data of Trading and Transfer © Towarowa Giełda Energii SA Rejestr Gwarancji Pochodzenia | Guarantees of Origin Register 698 151 Volume Transferred to the End Users (MWh) -178 Liczba zawartych transakcji Łączne obroty miesięczne zielonymi certyfikatami | Total Monthly Green Certificates Volumes | (MWh) 328 506 10-2019 1 659 769 -961 618 Number of Concluded Transactions Cena średnioważona (PLN/MWh) Change 116 496 1 524 566 11-2019 0,01 Miesięczny wolumen obrotu (MWh) 1,04 Page 14 from 17 1,05 Zmiana Weighted Average Price (PLN/MWh) 1 408 070 Monthly volume (MWh) Wolumen przekazany odbiorcom końcowym (MWh) 0 25 000 50 000 75 000 100 000 125 000 150 000 175 000 200 000 225 000
13. Listopad 2019 | November 2019 Rynek Praw Majątkowych | Property Rights Market Zarejestrowane transakcje pozasesyjne oraz sesyjne | Registered OTC and Session Deals Kontrakt PMOZE_A | PMOZE_A Contract Kontrakt PMOZE-BIO | PMOZE-BIO Contract Kontrakt PMEF | PMEF Contract Kontrakt PMEF_F | PMEF_F Contract Kontrakt PMEF-2019 | PMEF-2019 Contract © Towarowa Giełda Energii SA Rynek Praw Majątkowych | Property Rights Market 11,50 10-2019 Miesięczny wolumen (GWh) Średnioważona cena Średnioważona cena 29,64 10-2019 1 565,92 -1,23 60,79 Zmiana Change 2,07 Miesięczny wolumen (ktoe) -0,81 Monthly Volume (ktoe) Weighted Average Price (PLN/toe) 42,94 11-2019 1 635,50 1 564,09 11-2019 1 860,48 10-2019 Zmiana Change 10-2019 1,48 Monthly Volume (ktoe) Weighted Average Price (PLN/toe) Weighted Average Price (PLN/toe) Zmiana Change Monthly Volume (GWh) -294,56 Miesięczny wolumen (ktoe) 11-2019 Monthly Volume (GWh) Miesięczny wolumen (GWh) Weighted Average Price (PLN/MWh) 1 626,52 2,88 1 642,21 Page 13 from 17 Monthly Volume (ktoe) 11-2019 Średnioważona cena -17,17 -0,11 43,62 Średnioważona cena 142,54 302,56 131,04 302,45 Weighted Average Price (PLN/MWh) Zmiana Change 1 599,28 0,24 1 649,41 11-2019 22,89 Zmiana Change Miesięczny wolumen (ktoe) 71,41 18,23 -11,40 10-2019 Średnioważona cena
12. Listopad 2019 | November 2019 Rynek Praw Majątkowych | Property Rights Market Zarejestrowane transakcje pozasesyjne (rozliczane i nierozliczane) | Registered OTC Deals (Settled and Non-settled by CCH) Kontrakt PMOZE | PMOZE Contract Kontrakt PMOZE_A | PMOZE_A Contract Kontrakt PMOZE-BIO | PMOZE-BIO Contract Kontrakt PMBG | PMBG Contract Kontrakt PMEF | PMEF Contract Kontrakt PMEF_F | PMEF_F Contract Kontrakt PMEF-2019 | PMEF-2019 Contract © Towarowa Giełda Energii SA Rynek Praw Majątkowych (transakcje pozasesyjne) | Property Rights Market (OTC) 10-2019 Średnioważona cena TP 11-2019 3,71 1 501,49 695,31 11-2019 Number of Concluded Transactions 0,00 - - Number of Concluded Transactions 11-2019 0 9 Monthly OTC Volume (GWh) Number of Concluded Transactions 0 -1 2 0 Zmiana Change 11-2019 Średnioważona cena TP 10-2019 1 641,55 55,20 Miesięczny wolumen TP (ktoe) Monthly OTC Volume (ktoe) -10,00 WAvg OTC Price (PLN/toe) Number of Concluded Transactions Liczba zawartych transakcji Liczba zawartych transakcji 0 Number of Concluded Transactions 9 Monthly OTC Volume (GWh) Zmiana Change - Liczba zawartych transakcji 0,00 Zmiana Change 0,00 WAvg OTC Price (PLN/MWh) Miesięczny wolumen TP (ktoe) WAvg OTC Price (PLN/toe) Miesięczny wolumen TP (GWh) Średnioważona cena TP - - - 134,43 Monthly OTC Volume (ktoe) Miesięczny wolumen TP (ktoe) 10-2019 WAvg OTC Price (PLN/MWh) 10-2019 0 0 2 Zmiana Change -44 Średnioważona cena TP 291,03 Zmiana Change 2,00 2 1 Średnioważona cena TP 11-2019 0 298,70 0 Liczba zawartych transakcji WAvg OTC Price (PLN/MWh) 10-2019 262 - WAvg OTC Price (PLN/toe) Liczba zawartych transakcji Monthly OTC Volume (GWh) Zmiana Change Liczba zawartych transakcji 4,17 1 556,69 11-2019 - - Zmiana Change Monthly OTC Volume (GWh) 0,00 - Miesięczny wolumen TP (GWh) Number of Concluded Transactions 0,00 Średnioważona cena TP - Miesięczny wolumen TP (GWh) Liczba zawartych transakcji 0 0,00 Monthly OTC Volume (ktoe) 11-2019 0 0,05 0,45 0,00 Średnioważona cena TP WAvg OTC Price (PLN/MWh) Miesięczny wolumen TP (GWh) 0,00 866,68 123,40 Number of Concluded Transactions -171,37 11,03 7,67 10-2019 218 12,00 0,05 10-2019 0,00 0,00 0 Page 12 from 17
16. Listopad 2019 | November 2019 Rynek Dnia Następnego i Bieżącego gazu | Gas Day-Ahead and Intraday Market Średni miesięczny kurs EUR/PLN | EUR/PLN Monthly Average Exchange Rate Zbiorcze statystyki sesji | Overall Monthly Statistics © Towarowa Giełda Energii SA Rynek Dnia Następnego i Bieżącego gazu | Gas Day-Ahead and Intraday Market 22,96 75,89 202 617 12,47 53,65 740 319 Wolumen RDBg (MWh) 20,05 Zmiana Obroty miesięczne (MWh) i ceny średnioważone (PLN/MWh) | Monthly Volumes (MWh) and Weighted Average Prices (PLN/MWh) 4,72 Day-Ahead Market Volume (MWh) Intraday Volume (MWh) Statystyki miesięczne 17,19 572 551 Średnioważona cena RDBg (PLN/MWh) Page 16 from 17 167 768 17,70 52,92 73,69 12,30 5,40 Weighted Average Intraday Price (EUR/MWh) Wolumeny dzienne | Daily Volumes | (MWh) Weighted Average Day-Ahead Price (EUR/MWh) Wolumen RDNg (MWh) 11-2019 Monthly statistics Średnioważona cena RDNg (PLN/MWh) 1 849 752 1 647 135 10-2019 4,29 Change 40 50 60 70 80 90 100 110 120 130 140 0 500 000 1 000 000 1 500 000 2 000 000 2 500 000 3 000 000 3 500 000 4 000 000 4 500 000 5 000 000 1 2 3 4 5 6 7 8 9 10 11 12 1 2 3 4 5 6 7 8 9 10 11 12 1 2 3 4 5 6 7 8 9 10 11 12 1 2 3 4 5 6 7 8 9 10 11 12 1 2 3 4 5 6 7 8 9 10 11 2015 2016 2017 2018 2019 RDNg | Gas Day-Ahead Market RDBg | Gas Intraday Market cena RDNiBg | spot price 0 25 000 50 000 75 000 100 000 125 000 150 000 175 000 200 000 225 000 1.11 3.11 5.11 7.11 9.11 11.11 13.11 15.11 17.11 19.11 21.11 23.11 25.11 27.11 29.11 RDNg | Gas Day-Ahead Market RDBg | Gas Intraday Market
11. Listopad 2019 | November 2019 Rejestr Świadectw Pochodzenia | Certificate of Origin Register Bilans praw majątkowych w Rejestrze | Register Balance by Contracts Kontrakt PMOZE | PMOZE Contract (kWh) Kontrakt PMOZE_A | PMOZE_A Contract (kWh) Kontrakt PMOZE-BIO | PMOZE-BIO Contract (kWh) Kontrakt PMBG | PMBG Contract (kWh) Kontrakt PMEF | PMEF Contract (mtoe) Kontrakt PMEF_F | PMEF_F Contract (mtoe) Kontrakt PMEF-2019 | PMEF-2019 Contract (mtoe) © Towarowa Giełda Energii SA Rejestr Świadectw Pochodzenia | Certificate of Origin Register 11-2019 Umorzone Blocked for redemption Umorzone 0 Zablokowane do umorzenia 36 434 068 11-2019 Blocked for redemption 0 36 434 068 Od początku istnienia 1 091 359 637 Issued 51 939 4 734 771 Redempted Page 11 from 17 Zablokowane do umorzenia 0 54 161 519 From the beginning 11-2019 Zablokowane do umorzenia 0 54 161 519 355 665 401 Wystawione Issued 5 660 615 Balance 6 817 491 Balance Blocked for redemption Redempted 0 63 062 63 062 Zablokowane do umorzenia Zablokowane do umorzenia 1 434 766 703 From the beginning Blocked for redemption Bilans 0 5 660 615 148 937 443 946 Od początku istnienia Bilans 395 524 555 Redempted 0 Balance 33 238 053 0 0 Bilans Umorzone Balance Bilans 0 19 028 272 741 Redempted 7 157 888 Wystawione 162 928 Od początku istnienia Wystawione Umorzone Blocked for redemption 0 Umorzone 919 728 202 40 418 022 1 447 025 038 Wystawione 11-2019 Od początku istnienia Redempted Od początku istnienia Od początku istnienia Balance 0 Issued Zablokowane do umorzenia 4 734 771 0 0 2 327 175 275 919 728 202 0 0 Redempted 0 Balance 30 967 311 077 0 1 830 291 258 0 Blocked for redemption Wystawione 314 689 627 179 904 755 023 0 Balance 11-2019 Wystawione Zablokowane do umorzenia Issued 0 From the beginning From the beginning 7 382 148 Wystawione Bilans Blocked for redemption Redempted Issued Umorzone Bilans From the beginning 88 360 11-2019 From the beginning 19 020 890 593 Issued 40 329 662 Bilans 6 467 169 Umorzone Od początku istnienia 11-2019 From the beginning Issued
10. Listopad 2019 | November 2019 Rynek Praw Majątkowych | Property Rights Market Miesięczne zestawienie z transakcji sesyjnych dla poszczególnych kontraktów | Overall Session Statistics by Contracts Kontrakt PMEF-2019 | PMEF-2019 Contract toe PLN/toe toe PLN/toe Statystyki sesji z ostatnich 12 miesięcy | Monthly Session Statistics for the Last 12 Months PLN/toe © Towarowa Giełda Energii SA Rynek Praw Majątkowych | Property Rights Market PMEF-2018 PMEF-2019 - 10-2019 1 598,15 06-2019 - 1 599,28 2 876 1 506,68 04-2019 03-2019 TGEef19 - MAX 29,86 3 145 1 652,22 3 415 1 085 1 653,75 1 356 1 333,08 3 102 07-2019 - w tym / including: Wolumen na Fixingu 216 139,04 1 612,89 - 1 590,00 1 650,36 Wolumen w notowaniach ciągłych 208,75 382,70 2 529 Miesiąc 1 630,00 3 378 - Continuous Trading Volume Sesje PMEF-2019 - Wolumen i indeks TGEef19 | Trading Sessions for PMEF-2019 contract - Volumes and TGEef19 index 08-2019 1 755 Month 1 852 05-2019 -677 - 1 543,25 3 240 toe Volume 2 969 09-2019 Zmiana Change 1 599,28 2 068 2 876 Monthly Total Volume (toe) -131 Auction Volume 1 650,00 37,11 10-2019 -808 347 7 937 90,45 Volume Cena średnioważona (PLN/toe) 1 642,21 - Page 10 from 17 42,94 229,20 17 543 325,88 - 2 043 1 653,75 11-2019 - - 11-2019 02-2019 01-2019 0 645 12-2018 PLN/toe toe Monthly low TGEef19 index Śr. waż. cena Wolumen Śr. waż. cena Wolumen 40,00 1 642,21 2 068 WAvg Price - PLN/toe 10 666 Wolumen miesięczny (toe) - Weighted Average Price (PLN/toe) Monthly high TGEef19 lndex TGEef19 - MIN 4 403 - WAvg Price 0 250 500 750 1 000 1 250 1 500 1 750 0 1 500 3 000 4 500 6 000 7 500 9 000 10 500 5.11 7.11 12.11 14.11 19.11 21.11 26.11 Wolumen | Volume Indeks TGEef18 | TGEef18 Index 0 250 500 750 1 000 1 250 1 500 1 750 12-2018 01-2019 02-2019 03-2019 04-2019 05-2019 06-2019 07-2019 08-2019 09-2019 10-2019 11-2019 PMEF-2018 - Cena średnioważona | Monthly WAvg Price PMEF-2019 - Cena średnioważona | Monthly WAvg Price 0 250 500 750 1 000 1 250 1 500 1 750 0 1 000 2 000 3 000 4 000 5 000 6 000 7 000 5.11 7.11 12.11 14.11 19.11 21.11 26.11 28.11 Wolumen | Volume Indeks TGEef19 | TGEef19 index
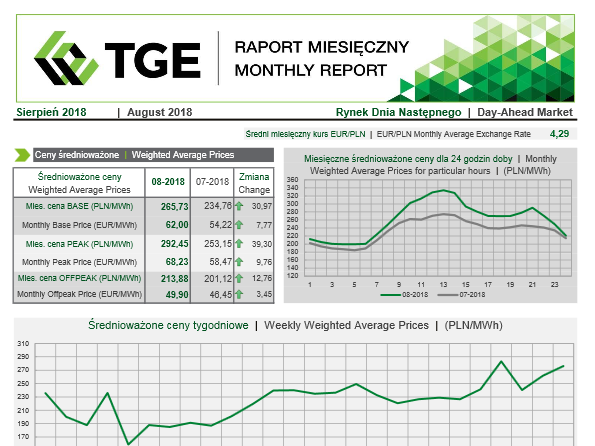
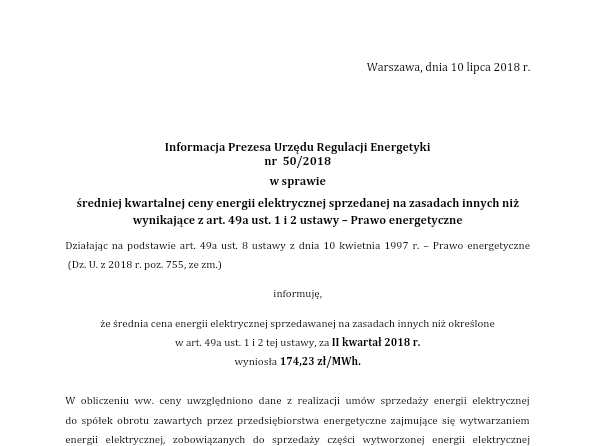
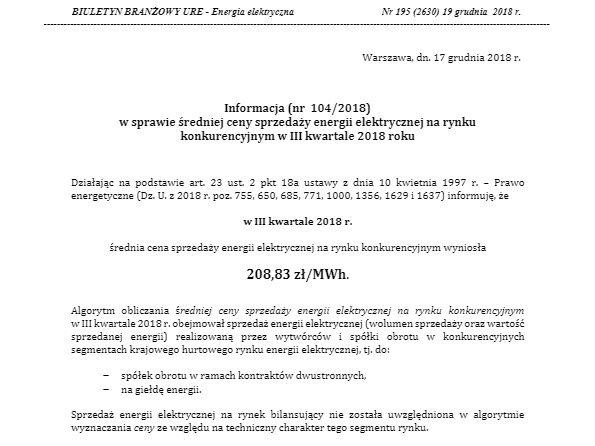
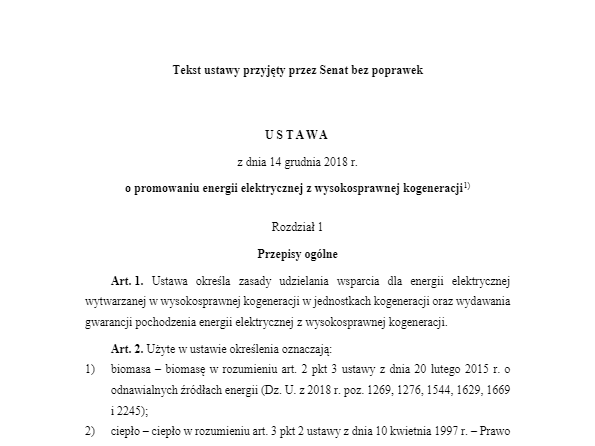
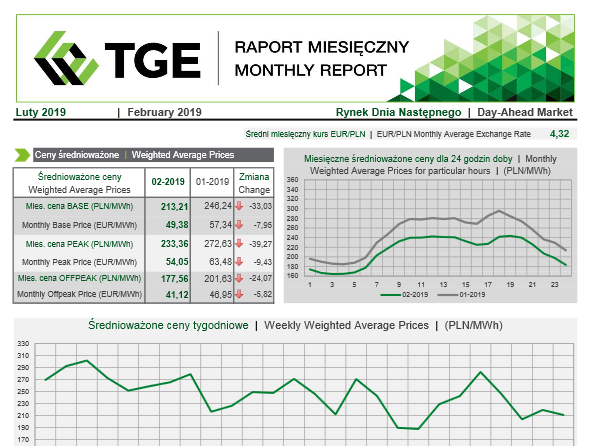
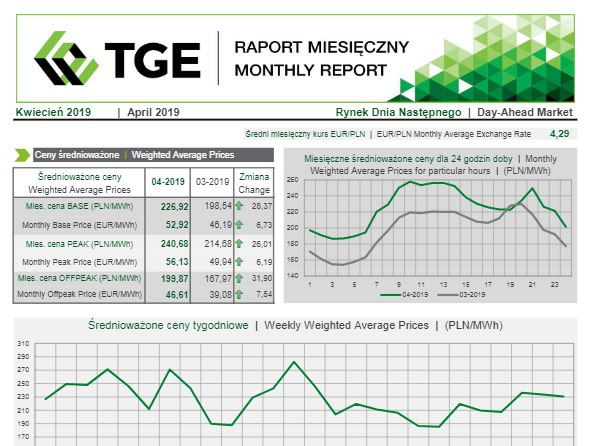
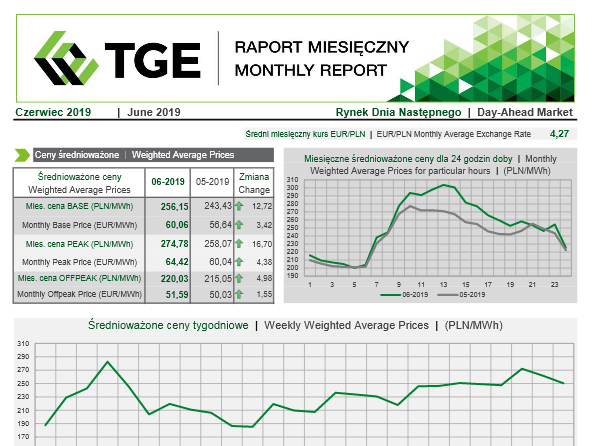
1. Listopad 2019 | November 2019 Rynek Dnia Następnego | Day-Ahead Market Średni miesięczny kurs EUR/PLN | EUR/PLN Monthly Average Exchange Rate Ceny średnioważone | Weighted Average Prices © Towarowa Giełda Energii SA Rynek Dnia Następnego | Day-Ahead Market 4,29 50,82 52,59 226,30 -8,40 54,77 Monthly Peak Price (EUR/MWh) Średnioważone ceny tygodniowe | Weekly Weighted Average Prices | (PLN/MWh) Średnioważone ceny miesięczne | Monthly Weighted Average Prices | (PLN/MWh) 56,52 -1,76 Mies. cena OFFPEAK (PLN/MWh) Page 1 from 17 -2,43 Weighted Average Prices Monthly Base Price (EUR/MWh) 43,41 45,84 11-2019 Średnioważone ceny Change 186,13 197,24 -8,39 Miesięczne średnioważone ceny dla 24 godzin doby | Monthly Weighted Average Prices for particular hours | (PLN/MWh) Mies. cena BASE (PLN/MWh) 217,90 -1,77 -11,12 Monthly Offpeak Price (EUR/MWh) Mies. cena PEAK (PLN/MWh) 234,84 243,23 10-2019 Zmiana 160 170 180 190 200 210 220 230 240 250 260 270 280 1 3 5 7 9 11 13 15 17 19 21 23 11-2019 10-2019 130 140 150 160 170 180 190 200 210 220 230 240 250 260 270 280 1 3 5 7 9 11 1 3 5 7 9 11 1 3 5 7 9 11 1 3 5 7 9 11 1 3 5 7 9 11 1 3 5 7 9 11 1 3 5 7 9 11 1 3 5 7 9 11 1 3 5 7 9 11 1 3 5 7 9 11 1 3 5 7 9 11 2009 2010 2011 2012 2013 2014 2015 2016 2017 2018 2019 130 150 170 190 210 230 250 270 290 27/05 - 02/06 03/06 - 09/06 10/06 - 16/06 17/06 - 23/06 24/06 - 30/06 01/07 - 07/07 08/07 - 14/07 15/07 - 21/07 22/07 - 28/07 29/07 - 04/08 05/08 - 11/08 12/08 - 18/08 19/08 - 25/08 26/08 - 01/09 02/09 - 08/09 09/09 - 15/09 16/09 - 22/09 23/09 - 29/09 30/09 - 06/10 07/10 - 13/10 14/10 - 20/10 21/10 - 27/10 28/10 - 03/11 04/11 - 10/11 11/11 - 17/11 18/11 - 24/11
6. Listopad 2019 | November 2019 Rynek Terminowy Towarowy | Commodity Forward Instruments Market © Towarowa Giełda Energii SA Rynek Terminowy Towarowy | Commodity Forward Instruments Market 12 735 089 2 856 02-2019 3 882 12 462 005 1 458 1 326 150 3 226 710 7 12 084 6 414 01-2019 03-2019 5 163 14 552 682 1 381 1 638 825 6 556 16 205 169 05-2019 4 570 7 035 6 305 2 002 7 226 10-2019 5 116 22 831 324 1 100 4 908 15 283 149 MW 09-2019 2019 49 512 161 549 022 13 064 21 216 480 105 102 200 MW 3 178 11 685 810 1 032 945 22 0 13 893 506 3 838 13 422 738 1 060 1 847 775 Month 04-2019 MWh Volume Traded Contracts 5 667 20 519 725 1 554 3 319 545 5 5 443 743 Wol. obrotu Wol. obrotu L. kontr. 16 334 12 744 Miesięczne statystyki dla energii elektrycznej | Monthly Statistics for Electricity 19 508 683 MW 23 841 272 14 12 520 5 684 15 480 486 12-2018 10 12 636 Obroty miesięczne energią elektryczną | Monthly Electricity Volumes | (MWh) 1 412 280 14 1 620 135 07-2019 5 199 Statystyki dla kontraktów notowanych w systemie aukcji | Statistics for Contracts Quoted in Auction Trading System Traded Contr. 17 040 BASE LOAD PEAK5 LOAD 8 06-2019 4 013 21 21 417 6 312 14 473 354 Page 6 from 17 12 335 691 951 5 315 1 291 26 070 118 12 831 802 08-2019 4 981 16 092 418 1 312 2 565 990 OFFPEAK LOAD TOTAL 1 092 13 662 Volume 5 348 Volume Traded Contr. 4 978 MW 542 1 574 460 13 765 011 18 665 443 62 681 12 3 060 13 791 215 5 783 802 3 742 3 635 Obroty roczne energią elektryczną | Annual Electricity Volumes | (MWh) 182 867 702 L. kontr. Liczba kontraktów Traded Contr. Volume MWh MWh MWh Wol. obrotu W listopadzie 2019 roku na Rynku Terminowym Towarowym nie odbyły się żadne aukcje. | In November 2019 there were no auctions on Commodity Forward Instruments Market. Wolumen obrotu L. kontr. 777 339 315 2 11-2019 4 227 17 163 388 1 088 2 345 295 0 Miesiąc 0 2 500 000 5 000 000 7 500 000 10 000 000 12 500 000 15 000 000 17 500 000 20 000 000 22 500 000 25 000 000 27 500 000 30 000 000 12-2018 01-2019 02-2019 03-2019 04-2019 05-2019 06-2019 07-2019 08-2019 09-2019 10-2019 11-2019 0 25 000 000 50 000 000 75 000 000 100 000 000 125 000 000 150 000 000 175 000 000 200 000 000 2009 2010 2011 2012 2013 2014 2015 2016 2017 2018 2019
17. Listopad 2019 | November 2019 Indeksy Rynku Węgla Energetycznego | Steam Coal Market Indexes Polskie Indeksy Rynku Węgla Energetycznego dla ostatnich 12 miesięcy | Polish Steam Coal Market Indexes for the last 12 Months * PLN/t PLN/GJ © Towarowa Giełda Energii SA Indeksy Rynku Węgla Energetycznego | Steam Coal Market Indexes % -1,58 308,91 313,80 0,27 -1,68 5,38 0,17 Cena Zmiana Cena % 260,91 13,00 308,22 -0,22 6,85 09.2019 263,36 0,08 12,93 1,25 -3,77 0,39 1,01 12,17 0,58 1,07 Change -0,15 Change -1,42 11,91 -0,42 03.2019 -3,45 11,83 312,07 Month 12.2018 Page 17 from 17 13,28 12,88 * Indeksy PSCMI dla poszczególnych miesięcy publikowane są z miesięcznym opóźnieniem. | PSCMI indexes for particular months are being published with one month delay. 12,61 12,87 10.2019 266,03 więcej danych z rynku węgla pod adresem | more data from coal market on website gpi.tge.pl Polskie Indeksy Rynku Węgla Energetycznego dla ostatnich 12 miesięcy | Polish Steam Coal Market Indexes for the last 12 Months * 08.2019 258,89 -1,56 05.2019 256,52 07.2019 04.2019 12,76 -2,11 325,23 260,00 1,73 12,10 1,60 -0,85 12,98 12,87 11,96 1,10 01.2019 263,75 11,91 0,00 1,96 2,06 11,89 3,22 -1,64 254,77 06.2019 3,02 11,33 0,44 297,24 2,08 -0,85 13,01 11,86 313,02 304,62 2,82 -0,43 258,14 0,85 1,68 -2,03 -3,60 12,11 0,25 307,81 Zmiana % -2,46 300,91 4,85 % PLN/GJ PLN/t 250,78 PSCMI 2 PLN/t Price Price Change Cena Zmiana 11,91 Zmiana -2,31 3,90 312,97 -1,04 02.2019 255,97 0,47 PLN/GJ 12,42 12,82 11.2018 241,76 PSCMI 1 Price 2,76 2,29 311,66 Price Change 11,10 Miesiąc Cena 10,00 10,25 10,50 10,75 11,00 11,25 11,50 11,75 12,00 12,25 12,50 12,75 13,00 13,25 13,50 13,75 14,00 14,25 14,50 14,75 15,00 230 235 240 245 250 255 260 265 270 275 280 285 290 295 300 305 310 315 320 325 330 11.2018 12.2018 01.2019 02.2019 03.2019 04.2019 05.2019 06.2019 07.2019 08.2019 09.2019 10.2019 PSCMI 1 (PLN/t) PSCMI 2 (PLN/t) PSCMI 1 (PLN/GJ) PSCMI 2 (PLN/GJ)
2. Listopad 2019 | November 2019 Rynek Dnia Następnego | Day-Ahead Market Wolumeny obrotu | Volumes | (MWh) © Towarowa Giełda Energii SA Rynek Dnia Następnego | Day-Ahead Market -100 725 94 323 Wolumeny tygodniowe | Weekly Volumes | (MWh) Łączny wolumen dla godzin doby | Hourly Total Volumes | (MWh) Monthly Statistics Wolumen BASE Monthly Base Volume 93 522 Wolumeny miesięczne | Monthly Volumes | (MWh) 1 076 354 Change -118 374 Wolumen OFFPEAK 10-2019 975 630 Page 2 from 17 Wolumeny dzienne | Daily Volumes | (MWh) Monthly Offpeak Volume Średni wolumen dzienny 1 830 017 2 805 646 Zmiana 2 924 020 Monthly Peak Volume Wolumen PEAK 1 847 666 -17 649 Statystyki miesięczne 11-2019 Average Daily Volume -802 0 20 000 40 000 60 000 80 000 100 000 120 000 1.11 3.11 5.11 7.11 9.11 11.11 13.11 15.11 17.11 19.11 21.11 23.11 25.11 27.11 29.11 1 fixing | Auction No. 1 2 fixing | Auction No. 2 Notowania ciągłe | Continuous Hourly Kontrakty blokowe | Blocks 0 20 000 40 000 60 000 80 000 100 000 120 000 140 000 1 3 5 7 9 11 13 15 17 19 21 23 1 fixing | Auction No. 1 2 fixing | Auction No. 2 Notowania ciągłe | Continuous Hourly Kontrakty blokowe | Blocks 0 100 000 200 000 300 000 400 000 500 000 600 000 700 000 800 000 27/05 - 02/06 03/06 - 09/06 10/06 - 16/06 17/06 - 23/06 24/06 - 30/06 01/07 - 07/07 08/07 - 14/07 15/07 - 21/07 22/07 - 28/07 29/07 - 04/08 05/08 - 11/08 12/08 - 18/08 19/08 - 25/08 26/08 - 01/09 02/09 - 08/09 09/09 - 15/09 16/09 - 22/09 23/09 - 29/09 30/09 - 06/10 07/10 - 13/10 14/10 - 20/10 21/10 - 27/10 28/10 - 03/11 04/11 - 10/11 11/11 - 17/11 18/11 - 24/11 0 500 000 1 000 000 1 500 000 2 000 000 2 500 000 3 000 000 1 3 5 7 9 11 1 3 5 7 9 11 1 3 5 7 9 11 1 3 5 7 9 11 1 3 5 7 9 11 1 3 5 7 9 11 1 3 5 7 9 11 1 3 5 7 9 11 1 3 5 7 9 11 1 3 5 7 9 11 1 3 5 7 9 11 2009 2010 2011 2012 2013 2014 2015 2016 2017 2018 2019
7. Listopad 2019 | November 2019 Rynek Praw Majątkowych | Property Rights Market Miesięczne zestawienie z transakcji sesyjnych dla poszczególnych kontraktów | Overall Session Statistics by Contracts Kontrakt PMOZE | PMOZE Contract Kontrakt PMOZE_A | PMOZE_A Contract MWh PLN/MWh MWh PLN/MWh Statystyki sesji z ostatnich 12 miesięcy | Monthly Session Statistics for the Last 12 Months PLN/MWh © Towarowa Giełda Energii SA Rynek Praw Majątkowych dla OZE | Property Rights Market for RES Auction Volume Wolumen na Fixingu 0 Wolumen w notowaniach ciągłych Sesje PMOZE - Wolumen i indeks TGEoze | Trading Sessions for PMOZE contract - Volumes and TGEoze index Wolumen Volume 1 501 129,47 101,46 - - 10-2019 02-2019 - 130,99 09-2019 130,80 - 887 795 05-2019 0 MWh 951 708 812 957 11-2019 - 118,25 - PMOZE 0 WAvg Price - 884 185 - 01-2019 Śr. waż. cena 0 Continuous Trading Volume Wolumen miesięczny (MWh) Monthly Total Volume (MWh) Auction Volume PMOZE_A - 10-2019 1 205 556 12-2018 WAvg Price 0 03-2019 TGEozea - MAX Volume 0 741 110 Miesiąc Month 134,59 PLN/MWh 153,07 139,80 0 133,53 911 896 0 143,79 993 803 104 748 11-2019 - Cena średnioważona (PLN/MWh) Monthly low TGEoze index 0 TGEoze - MAX - - - Cena średnioważona (PLN/MWh) 149,02 11,32 Wolumen MWh 0 0 870 616 Weighted Average Price (PLN/MWh) - Wolumen na Fixingu 0 0 149,02 132,04 08-2019 798 566 - - 96,38 Śr. waż. cena 04-2019 0 10-2019 11-2019 6,48 870 616 Monthly high TGEoze index 0 - - - Monthly Total Volume (MWh) 06-2019 150,27 w tym / including: Sesje PMOZE_A - Wolumen i indeks TGEozea | Trading Sessions for PMOZE_A contract - Volumes and TGEozea index 134,60 TGEoze - MIN 0 - Wolumen miesięczny (MWh) PLN/MWh 0 -123 187 Monthly high TGEozea index Zmiana Change 12,41 137,70 Zmiana Change Weighted Average Price (PLN/MWh) 1 241 739 Page 7 from 17 07-2019 0 Wolumen w notowaniach ciągłych 809 255 889 055 61 360 Continuous Trading Volume w tym / including: -43 388 TGEozea - MIN -79 799 Monthly low TGEozea index 147,01 137,70 993 803 0 0 779 295 75 100 125 150 175 0 40 000 80 000 120 000 160 000 5.11 7.11 12.11 14.11 19.11 21.11 26.11 28.11 Wolumen | Volume Indeks TGEoze | TGEoze index 75 100 125 150 175 0 40 000 80 000 120 000 160 000 5.11 7.11 12.11 14.11 19.11 21.11 26.11 28.11 Wolumen | Volume Indeks TGEozea | TGEozea index 25 50 75 100 125 150 175 12-2018 01-2019 02-2019 03-2019 04-2019 05-2019 06-2019 07-2019 08-2019 09-2019 10-2019 11-2019 PMOZE - Cena średnioważona | Monthly WAvg Price PMOZE_A - Cena średnioważona | Monthly WAvg Price
8. Listopad 2019 | November 2019 Rynek Praw Majątkowych | Property Rights Market Miesięczne zestawienie z transakcji sesyjnych dla poszczególnych kontraktów | Overall Session Statistics by Contracts Kontrakt PMOZE-BIO | PMOZE-BIO Contract Kontrakt PMBG | PMBG Contract MWh PLN/MWh MWh PLN/MWh Statystyki sesji z ostatnich 12 miesięcy | Monthly Session Statistics for the Last 12 Months PLN/MWh © Towarowa Giełda Energii SA Rynek Praw Majątkowych dla OZE | Property Rights Market for RES - - - Monthly low TGEozebio index Monthly low TGEbg index Wolumen na Fixingu 37 077 Sesje PMOZE-BIO - Wolumen i indeks TGEozebio | Trading Sessions for PMOZE-BIO contract - Volumes and TGEozebio index Sesje PMBG - Wolumen i indeks TGEbg | Trading Sessions for PMBG contract - Volumes and TGEbg index - - - 0 09-2019 55 031 0 07-2019 292,74 51 056 11-2019 03-2019 300,36 01-2019 42 314 -0,47 Śr. waż. cena Wolumen 10-2019 TGEbg - MAX 57 078 0 0 MWh - 38 842 12-2018 300,65 04-2019 06-2019 303,03 43 683 -18 094 MWh - 36 229 11-2019 302,53 35 294 301,57 39 452 32 379 10-2019 303,67 304,23 0 - 0 Month 300,22 TGEozebio - MAX 468 0 - 08-2019 299,50 0 - 0 Wolumen w notowaniach ciągłych 35 819 TGEozebio - MIN 300,43 05-2019 56 051 WAvg Price Volume Weighted Average Price (PLN/MWh) Weighted Average Price (PLN/MWh) - 302,81 Wolumen w notowaniach ciągłych Auction Volume 303,31 - 02-2019 Monthly Total Volume (MWh) Volume w tym / including: 0 -17 626 Miesiąc PMOZE-BIO - 300,65 - - -0,56 Continuous Trading Volume 0 Śr. waż. cena Wolumen PLN/MWh 3 223 2 754 297,69 0 Page 8 from 17 - 0 - - 0 0 11-2019 0 - 0 0 Auction Volume -1,24 Wolumen miesięczny (MWh) Zmiana Change 39 452 57 078 Zmiana Change TGEbg - MIN 10-2019 Monthly high TGEbg index Wolumen na Fixingu Monthly Total Volume (MWh) 0 54 323 WAvg Price Monthly high TGEozebio index Cena średnioważona (PLN/MWh) - Cena średnioważona (PLN/MWh) w tym / including: Wolumen miesięczny (MWh) 302,84 Continuous Trading Volume PLN/MWh PMBG 0 302,84 0 303,31 290 295 300 305 310 315 320 12-2018 01-2019 02-2019 03-2019 04-2019 05-2019 06-2019 07-2019 08-2019 09-2019 10-2019 11-2019 PMOZE-BIO - Cena średnioważona | Monthly WAvg Price PMBG - Cena średnioważona | Monthly WAvg Price 285 290 295 300 305 310 0 3 000 6 000 9 000 12 000 15 000 5.11 7.11 12.11 14.11 19.11 21.11 26.11 28.11 Wolumen | Volume Indeks TGEozebio | TGEozebio index 285 290 295 300 305 310 0 3 000 6 000 9 000 12 000 15 000 5.11 7.11 12.11 14.11 19.11 21.11 26.11 28.11 Wolumen | Volume Indeks TGEbg | TGEbg index
9. Listopad 2019 | November 2019 Rynek Praw Majątkowych | Property Rights Market Miesięczne zestawienie z transakcji sesyjnych dla poszczególnych kontraktów | Overall Session Statistics by Contracts Kontrakt PMEF_F | PMEF_F Contract Kontrakt PMEF | PMEF Contract toe PLN/toe toe PLN/toe Statystyki sesji z ostatnich 12 miesięcy | Monthly Session Statistics for the Last 12 Months PLN/toe © Towarowa Giełda Energii SA Rynek Praw Majątkowych | Property Rights Market Wolumen miesięczny (toe) 06-2019 1 626,52 Sesje PMEF_F - Wolumen i indeks TGEeff | Trading Sessions for PMEF_F contract - Volumes and TGEeff index 74 487 08-2019 Śr. waż. cena 1 654,00 1 654,00 262 Miesiąc toe 1 631,20 16 235 1 558,94 WAvg Price 12-2018 352 WAvg Price 227 11-2019 Volume 321,91 1 690 10-2019 Weighted Average Price (PLN/toe) 1 625,00 1 475 15 Wolumen 193 1 477,50 412 02-2019 1 513,95 1 384,21 80,11 1 645,21 1 608,45 PLN/toe PMEF 102 TGEeff - MAX Month 05-2019 1 653,84 1 651,53 66 648 999 09-2019 14 657 Zmiana Change Monthly low TGEeff index 3 329 1 643,56 Auction Volume Śr. waż. cena Wolumen Volume 38,52 837 10-2019 1 653,66 322,99 TGEeff - MIN 1 635,00 18,56 -87 11-2019 17 635 -1 282 Monthly low TGEef index 1 606,69 1 626,52 Monthly high TGEeff index Monthly Total Volume (toe) 1 651,53 Cena średnioważona (PLN/toe) 193 Auction Volume 1 606,69 TGEef - MIN Cena średnioważona (PLN/toe) 1 690,00 Continuous Trading Volume Wolumen na Fixingu -1 196 178 1 475 Wolumen w notowaniach ciągłych 1 645,21 PLN/toe PMEF_F w tym / including: 13 516 3 754 Continuous Trading Volume Wolumen na Fixingu 29 372 55,00 25,01 Monthly Total Volume (toe) Wolumen w notowaniach ciągłych 417 03-2019 1 654,00 1 727 1 362 16 235 12 905 07-2019 1 678,44 11-2019 Zmiana Change -2 238 1 635,09 17 635 Sesje PMEF - Wolumen i indeks TGEef | Trading Sessions for PMEF contract - Volumes and TGEef index 2 492 Page 9 from 17 1 627,81 Monthly high TGEef index 10-2019 251,80 12 355 812,13 1 599,34 35,75 -1 400 15 143 50,63 Weighted Average Price (PLN/toe) TGEef - MAX Wolumen miesięczny (toe) 153,20 22 448 27 527 01-2019 04-2019 w tym / including: 9 962 1 478,26 1 572,90 toe 47 063 1 374 31,40 0 250 500 750 1 000 1 250 1 500 1 750 0 1 000 2 000 3 000 4 000 5 000 6 000 7 000 5.11 7.11 12.11 14.11 19.11 21.11 26.11 28.11 Wolumen | Volume Indeks TGEeff | TGEeff index 0 250 500 750 1 000 1 250 1 500 1 750 0 1 000 2 000 3 000 4 000 5 000 6 000 7 000 5.11 7.11 12.11 14.11 19.11 21.11 26.11 28.11 Wolumen | Volume Indeks TGEef | TGEef index 0 250 500 750 1 000 1 250 1 500 1 750 12-2018 01-2019 02-2019 03-2019 04-2019 05-2019 06-2019 07-2019 08-2019 09-2019 10-2019 11-2019 PMEF_F - Cena średnioważona | Monthly WAvg Price PMEF - Cena średnioważona | Monthly WAvg Price
3. Listopad 2019 | November 2019 Rynek Dnia Bieżącego | Intraday Market Średni miesięczny kurs EUR/PLN | EUR/PLN Monthly Average Exchange Rate Miesięczne ceny średnioważone dla poszczególnych godzin | Monthly Weighted Average Prices for particular hours Statystyki miesięczne | Monthly Statistics © Towarowa Giełda Energii SA Rynek Dnia Bieżacego | Intraday Market 4,29 -9,27 11-2019 Wolumeny dzienne | Daily Volumes | (MWh) Page 3 from 17 765 Base Volume (MWh) 27 461 694 Change 24 Cena średnioważona (PLN/MWh) 196,57 28 155 222,46 51,88 61,15 232,46 -40,68 54,21 Monthly Statistics Łączny wolumen dla godzin doby | Hourly Total Volumes | (MWh) 10-2019 1 735 2 478 38,88 16 54,25 190,23 360 54,69 19 Statystki miesięczne 23 1 825 11 12 45,84 217,26 1 732 202,68 175 22 1 606 1 577 18 204,96 52,73 52,47 49,25 253 8 9 - -13,45 55,01 Wol. | Volume - 41,20 15 - 54,62 43,82 Miesięczne średnioważone ceny dla poszczególnych godzin | Monthly Weighted Average Prices for Particular Hours | (PLN/MWh) 2 106 179,85 - 151 41,94 PLN/ MWh Godz. | Hour 234,21 3 - 45,76 5 - 4 17 1 989 42,64 - 13 239,17 50,67 365 Zmiana | Change Godz. | Hour 232,64 41,88 179,56 187,91 176,68 Zmiana | Change - PLN/ MWh 582 101 50,99 7 226,12 -18,43 1 346 196,24 EUR/ MWh 1 171 44,51 - 1 185 229,45 6 263,14 - EUR/ MWh 1 Wol. | Volume 212 55,77 14 235,89 - 2 - 56,97 2 573 44,36 2 494 244,29 218,67 11,49 -62,26 20 182,84 224,98 42,64 -61,23 21 47,27 211,21 - Wolumen BASE (MWh) 10 588 190,86 - Weighted Average Price (EUR/MWh) 53,51 - 47,80 -60,12 Zmiana 34,85 234,51 786 160 180 200 220 240 260 280 300 1 3 5 7 9 11 13 15 17 19 21 23 11-2019 10-2019 0 250 500 750 1 000 1 250 1 500 1 750 2 000 2 250 2 500 2 750 1 3 5 7 9 11 13 15 17 19 21 23 0 500 1 000 1 500 2 000 2 500 3 000 3 500 4 000 4 500 5 000 1.11 3.11 5.11 7.11 9.11 11.11 13.11 15.11 17.11 19.11 21.11 23.11 25.11 27.11 29.11
15. Listopad 2019 | November 2019 Rynek Terminowy Towarowy | Commodity Forward Instruments Market Średni miesięczny kurs EUR/PLN | EUR/PLN Monthly Average Exchange Rate Zbiorcze miesięczne statystyki dla gazu ziemnego | Overall Monthly Statistics for Natural Gas Zbiorcze miesięczne statystyki dla gazu / Overall Monthly Statistics for Gas Łączny wolumen obrotu | Total Monthly Volume | (MWh) © Towarowa Giełda Energii SA Rynek Terminowy Towarowy (gaz) | Commodity Forward Instruments Market (gas) GAS_BASE_W-48-19 Products 4,29 Wolumen obrotu Volume L. kontr. Traded Contr. 70 - - - 4 032 PLN/MWh 58,50 0 3 6 24 18,46 79,00 - MWh 60 - 5 PLN/MWh 43 79,17 Średnioważony kurs transakcji WAvg Price 19,30 18,86 19,41 0 - 83,22 73,50 72,78 83,12 -9,60 91,72 -6,50 7 224 Kurs max High Price MWh Number of trades - 0 1 239 75 Zmiana kursu transakcji WAvg Price Change L. trans. No. of Trades 5 239 Liczba zawartych transakcji | 1 437 65,88 15,36 76,00 10 080 21,39 GAS_BASE_Q-2-20 GAS_BASE_Y-20 GAS_BASE_S-S-21 -3,79 - - - 312 19,25 18,87 21 960 - 88,00 72,00 GAS_BASE_Q-3-20 -5,02 75,33 89,63 74,50 GAS_BASE_Q-4-20 0 2 - -3,78 GAS_BASE_Q-1-20 0 87 840 90,00 94,75 GAS_BASE_S-W-20 0 17,72 80,90 6 624 16,97 1 226 400 -1,73 3 11 87,50 73,00 0 - 20,90 119 GAS_BASE_S-S-20 - 113 Page 15 from 17 91,75 -6 624 75,98 -183 960 78,50 Obroty miesięczne gazem ziemnym | Monthly Natural Gas Volumes | (MWh) Obroty roczne gazem ziemnym | Annual Natural Gas Volumes | (MWh) -6,38 1 906 128 83,25 90,19 92,50 952 224 17,57 90 79,00 82,53 140 - 120 120 222 -8,69 217 0 GAS_BASE_Y-21 1 482 257 286 138 397 488 -760 032 76 0 -90 569 0 20 218 689 208 392 77,00 21,03 75,50 272 832 182 80,70 - 80,00 -6,17 -1 388 388 86,00 679 GAS_BASE_M-03-20 - 0 499 968 0 82,00 665 0 - - 80,30 111 720 86,00 -5,22 921 816 GAS_BASE_M-01-20 78,45 GAS_BASE_W-47-19 Nazwa kontraktu -0,63 86,00 % - 269 352 18,29 19,38 GAS_BASE_M-02-20 - Średnioważony kurs transakcji WAvg Price 267 -1 059 456 975 - GAS_BASE_W-50-19 21 725 400 - Liczba kontraktów | - 80,00 8 813 033 - - - - 81,00 - 0 3 80,00 Zmiana obr. Vol. Change 58,50 PLN/MWh 14,90 72,25 Statystyki dla kontraktów notowanych w trakcie notowań ciągłych | Statistics for Contracts Quoted in Continuous Trading System Traded Contracts | (MW) 7 224 84,50 Kurs min Low Price 11 760 - 4 032 GAS_BASE_W-49-19 EUR/MWh GAS_BASE_W-01-20 80,50 10 080 63,87 GAS_BASE_W-46-19 - - - 82,76 GAS_BASE_M-12-19 80,86 0 0 GAS_BASE_W-51-19 - - - 0 GAS_BASE_W-52-19 0 2 500 000 5 000 000 7 500 000 10 000 000 12 500 000 15 000 000 12-2018 01-2019 02-2019 03-2019 04-2019 05-2019 06-2019 07-2019 08-2019 09-2019 10-2019 11-2019 0 25 000 000 50 000 000 75 000 000 100 000 000 125 000 000 2013 2014 2015 2016 2017 2018 2019
4. Listopad 2019 | November 2019 Rynek Terminowy Towarowy | Commodity Forward Instruments Market Średni miesięczny kurs EUR/PLN | EUR/PLN Monthly Average Exchange Rate Zbiorcze miesięczne statystyki dla energii elektrycznej | Overall Monthly Statistics for Electricity Łączny wolumen obrotu | Liczba kontraktów | Liczba zawartych transakcji | Total Monthly Volume | (MWh) Traded Contracts Number of Trades © Towarowa Giełda Energii SA Rynek Terminowy Towarowy | Commodity Forward Instruments Market 4,29 0 0 0 1 168 218 52 - 268,00 2 373 960 0 0 560 640 0 -5 498 784 48 0 0 0 BASE_W-52-19 BASE_W-51-19 - 168,00 213,98 225,00 0 464 - - - 319 920 - 35 712 - 0 194 392 0 0 2 0 0 - - 67 704 - BASE_M-01-20 228,00 0 237,00 -753 360 0 17 640 BASE_M-02-20 253,00 -5,35 51,31 218,02 0 - - BASE_M-12-19 BASE_W-01-20 - -1,24 - 168,00 336 51,87 219,46 - 54,19 32 592 BASE_W-50-19 -0,22 BASE_W-49-19 6 384 6 384 50,84 51,18 BASE_W-47-19 217,00 320 171 L. trans. No. of Trades 80 Miesięczne | Month - 51,87 97 005 L. kontr. | Traded Contracts 14 573 400 1 660 77 BASE_W-48-19 39,18 197 0 Roczne | Calendar 28 728 33 096 222,42 Nazwa kontraktu Średnioważony kurs transakcji WAvg Price Średnioważony kurs transakcji WAvg Price Zmiana kursu WAvg Price Change Kurs min Low Price 26 040 229,00 BASE_W-46-19 761 0 0 Roczne | Calendar 222,42 Typ OFFPEAK OFFPEAK type Tygodniowe | Week EUR/MWh L. trans. | No. of Trades 803 799 1 082 640 PLN/MWh L. trans. | No. of Trades 149 724 Miesięczne | Month Kwartalne | Quarter Kurs max High Price 0 220,00 -2,65 179 30 478 PLN/MWh 41 700 0 1 438 Tygodniowe | Week L. trans. | No. of Trades 76 3 747 5 315 L. kontr. | Traded Contracts 364 Tygodniowe | Week 121 632 Typ PEAK5 PEAK5 type L. kontr. | Traded Contracts Wolumen | Volume | (MWh) Typ BASE BASE type 19 508 683 0 Miesięczne statystyki dla kontraktów notowanych w trakcie notowań ciągłych z dostawą energii elektrycznej | Monthly Statistics for Contracts Quoted in Continuous Trading System with Delivery of Electricity MWh 10 830 336 253,36 237,00 0 230,50 0 Products 575 Miesięczne | Month Wolumen | Volume | (MWh) Roczne | Calendar 1 664 557 232,36 249,12 53,77 58,10 2 195 760 Wolumen | Volume | (MWh) 44 Kwartalne | Quarter PLN/MWh 66 240 261,10 30 0 0 50 784 BASE_M-08-20 BASE_Q-2-20 BASE_Q-1-20 BASE_M-05-20 Kwartalne | Quarter 0 0 542 Wolumen obrotu Volume Zmiana obr. Vol. Change L. kontr. Traded Contr. 0 MWh % - 168,00 240,50 214,25 - - - 175 25 6 687 - 17 400 - 29 400 29 400 345 216 - 225,00 104 832 253,00 0 - - 0 1 281 421 - - 220,00 245,00 434 496 9 0 584 - 0 0 - 244,50 64 228,00 230,56 - 217,00 238,00 23 352 139 220,00 - 220,00 2 0 38 207,90 -5,48 0 - - 96 256,00 -5,37 - - 0 274,00 -4,87 0 265,65 - - 591 593 0 0 8 760 - 244,00 0 212 064 256,00 271 268,50 0 1 325 - 261,87 BASE_M-03-20 BASE_Y-22 BASE_Y-21 BASE_Q-3-21 BASE_Q-3-20 - -0,14 257,00 BASE_Y-20 11 638 800 - 56,90 - 236,00 241,00 - 258,00 - 255,90 59,79 - 263,33 243,99 - - 57,10 59,68 -2,64 61,25 - 256,39 - BASE_M-06-20 - - - -1,67 BASE_W-02-20 - 49,90 - - BASE_W-03-20 247,42 - 57,70 - - 61,07 262,65 - BASE_M-04-20 BASE_M-07-20 - 244,85 - - - - -2,29 BASE_Q-4-20 BASE_Q-2-21 BASE_Q-1-21 - - - -4,57 98 61,41 16 6 0 0 0 17 400 6 687 87 20 1 1 40 0 406 Page 4 from 17 0 262 0 0 356 0 28 587 68
5. Listopad 2019 | November 2019 Rynek Terminowy Towarowy | Commodity Forward Instruments Market © Towarowa Giełda Energii SA Rynek Terminowy Towarowy | Commodity Forward Instruments Market - OFFPEAK_Q-3-20 OFFPEAK_Q-2-20 - 0 - 0 OFFPEAK_W-01-20 - OFFPEAK_M-05-20 - OFFPEAK_M-06-20 - OFFPEAK_M-02-20 - 0 - - - - - 0 - OFFPEAK_W-52-19 - - - - - OFFPEAK_W-02-20 0 OFFPEAK_M-03-20 - - - OFFPEAK_W-48-19 - 301,00 0 117 180 0 0 - - - 0 307,00 0 - - - - OFFPEAK_W-50-19 OFFPEAK_Q-1-20 OFFPEAK_M-04-20 OFFPEAK_M-07-20 OFFPEAK_M-08-20 OFFPEAK_Q-4-20 OFFPEAK_M-01-20 0 - - - 0 12 3 525 1 275 - PEAK5_M-08-20 - PEAK5_M-05-20 72,76 - - - - 0 0 0 - - 900 261,00 - - - PEAK5_M-01-20 PEAK5_W-47-19 5 580 - 0 0 396 43 800 254,00 0 0 - 245 3 975 298,00 11 160 -5 940 3 0 0 0 1 920 - - 293,00 PEAK5_W-50-19 286,00 253,57 L. trans. No. of Trades 0 0 - - 0 12 1 275 0 1 20 475 268,00 13 0 330 7 30 780 - 2 700 0 Zmiana obr. Vol. Change 47 24 - - 780 263,00 270,00 250,00 - 0 22 680 260,00 225,00 240 - 0 0 0 73 500 -19 845 0 - MWh - 4 240,00 L. kontr. Traded Contr. 3 525 - 52,47 - 61,91 MWh 240,00 53 900 - 3 975 Średnioważony kurs transakcji WAvg Price 135 Kurs min Low Price 246,00 248,00 Wolumen obrotu Volume PLN/MWh Kurs max High Price Zmiana kursu WAvg Price Change Products % 67,85 58,62 Średnioważony kurs transakcji WAvg Price 55,97 - Nazwa kontraktu PEAK5_W-48-19 58,46 257,00 225,00 249,14 288,60 1,26 67,30 - - PEAK5_W-46-19 - EUR/MWh PEAK5_W-51-19 PEAK5_W-02-20 - - 290,00 PEAK5_W-49-19 PLN/MWh PLN/MWh - - -2,47 - - - - 225,00 270,00 PEAK5_M-02-20 PEAK5_W-03-20 PEAK5_M-12-19 - 290,96 247,00 - 255,00 258,38 - 58,10 60,26 254,00 265,47 251,38 240,00 250,67 PEAK5_W-52-19 PEAK5_W-01-20 PEAK5_Y-22 - 294,00 PEAK5_M-03-20 294,00 - PEAK5_M-07-20 312,00 291,92 PEAK5_Q-2-20 -3,29 PEAK5_Q-3-20 68,08 PEAK5_Q-1-20 - - - - - 270,00 PEAK5_M-06-20 - PEAK5_M-04-20 - - 62,97 -1,14 281,00 287,60 - - - 0 - - - -1,31 - - - PEAK5_Q-3-21 OFFPEAK_W-49-19 - PEAK5_Y-20 - - - - PEAK5_Q-2-21 PEAK5_Y-21 70,95 - 300,72 OFFPEAK_W-47-19 - - PEAK5_Q-1-21 - OFFPEAK_W-46-19 -1,20 - - - - 0 5 940 0 70,13 0 - 300,00 - 71,22 67,07 - 304,23 - 301,00 563 880 -1,39 1 514 700 287,00 324,00 0 - 0 - 0 - PEAK5_Q-4-20 68,21 - - 289,50 - 288,00 OFFPEAK_W-51-19 0 - - - - - - - - - - 0 - - 0 292,50 - - 311,00 - - - - - - 305,40 - - - - - - - - - - - - - - - - - - - - - - - - - - 0 - - 0 0 0 - - - 0 - OFFPEAK_M-12-19 OFFPEAK_W-03-20 OFFPEAK_Y-20 - - - - - 0 - 0 OFFPEAK_Y-22 - - 0 OFFPEAK_Q-1-21 - OFFPEAK_Y-21 - - - OFFPEAK_Q-2-21 OFFPEAK_Q-3-21 0 - 0 - - - - 0 0 0 0 0 0 - 0 0 - -9 900 0 - - 0 0 0 0 - - - - 0 0 - 0 - - - 0 - - 0 0 - 0 0 - 0 0 0 0 0 - - - - 0 - 0 - 0 0 0 0 0 - 0 Page 5 from 17 0 0 0 53 340 0 0 0 0 297,00 1 920 0 0 0 0 - 0 0 0 0 0 0 0 310,50 0 0 0 -444 - -921 825 0 - 0 0 0 0 0 0 - - - 59,13 0 0 2 0 0 8 6 -1,58 - 2 14 0 9 2 700 10 19 0 5 0 0 0 6 0 0 - 135 2 0 0 0 0 148 27 0 6 2 17 1 38 - 0 0 65 0 0 0 0 31 112 0 0 0 0 0 18 585 330 339 0 - - - 0 0 - - 0 0 0 15 120